OpenTelemetry
tags :
Summary #
URL High-quality, ubiquitous, and portable telemetry to enable effective Observability
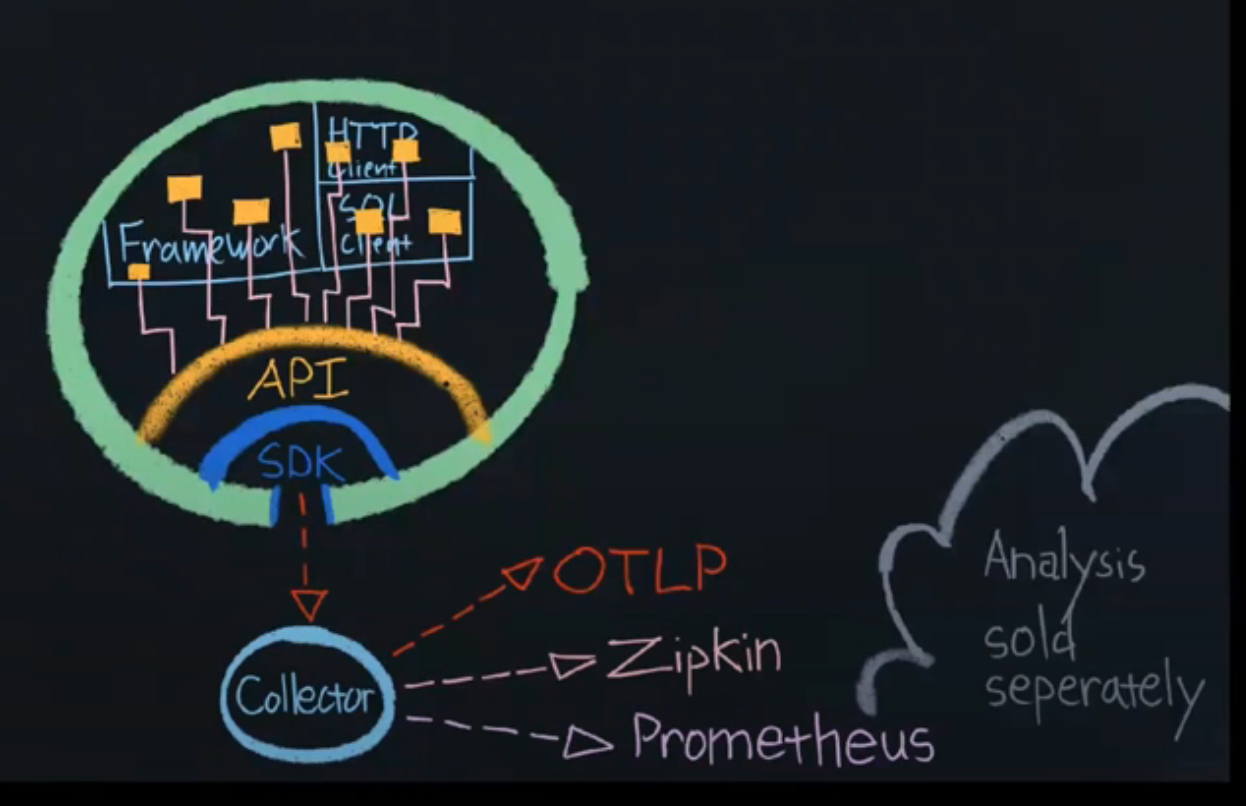
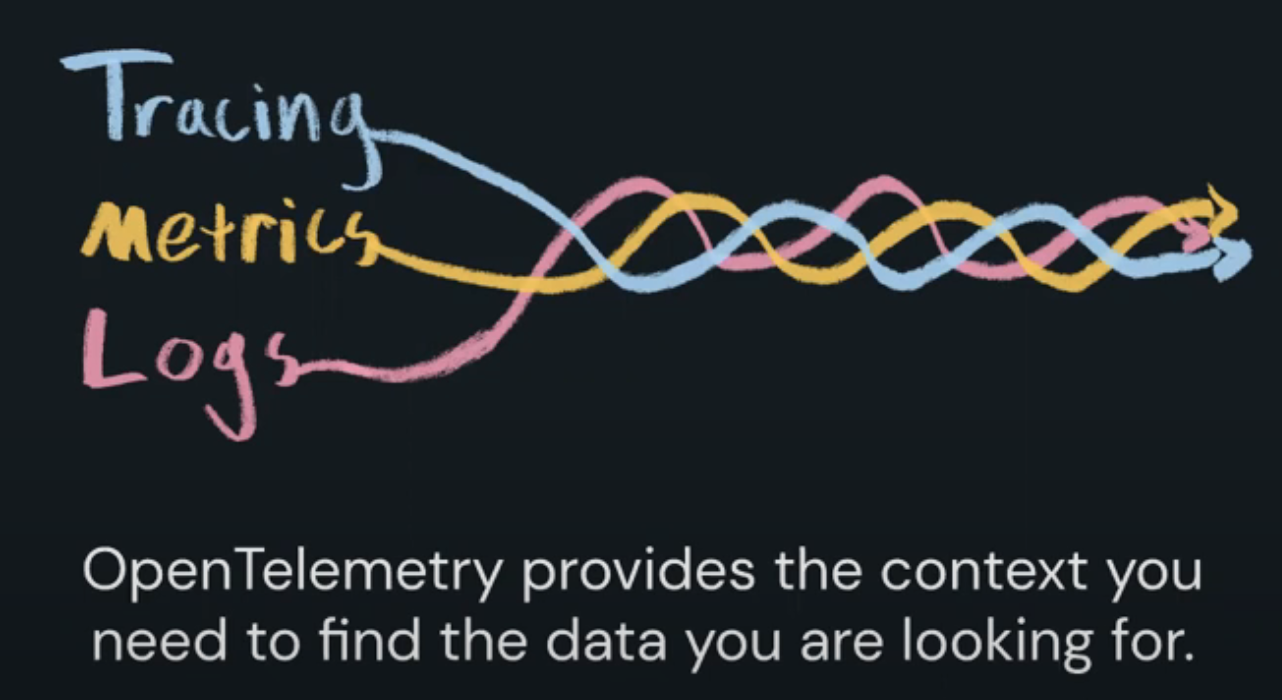
OpenTelemetry is a collection of APIs, SDKs, and tools. Use it to instrument, generate, collect, and export telemetry data (metrics, logs, and traces) to help you analyze your software’s performance and behavior.
distributed system
Spans
Basics #
Logs #
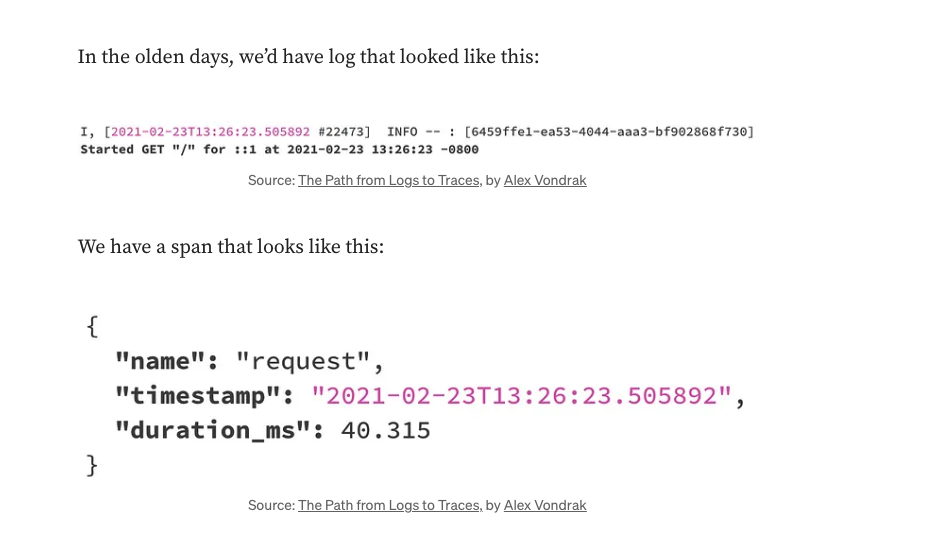
Logs are human-readable flat text files that are used by developers to capture useful data. Logs messages occur at a single point in time (though not necessarily at every point in time).
Unfortunately, log formats aren’t standardized across languages or framework, and they can be hard to parse and challenging to query. It’s also hard to group related logs together.
Events #
Events are structured logs. They follow a standardized format ( JSON), and are way easier to query.

Spans #
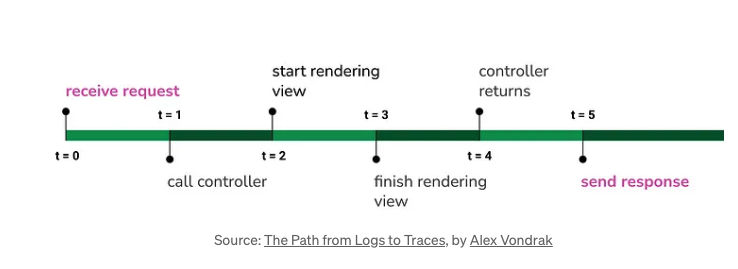
A Span represents a unit of work. They can be thought of as the work being done during an operation’s execution.
Logs represent occurrences at a specific point in time. Events aren’t that much more useful, other than being easier to read and query. The problem is that in isolation, Events don’t really tell a story. What if instead, we captured info for a given block of time (i.e. a time span)?
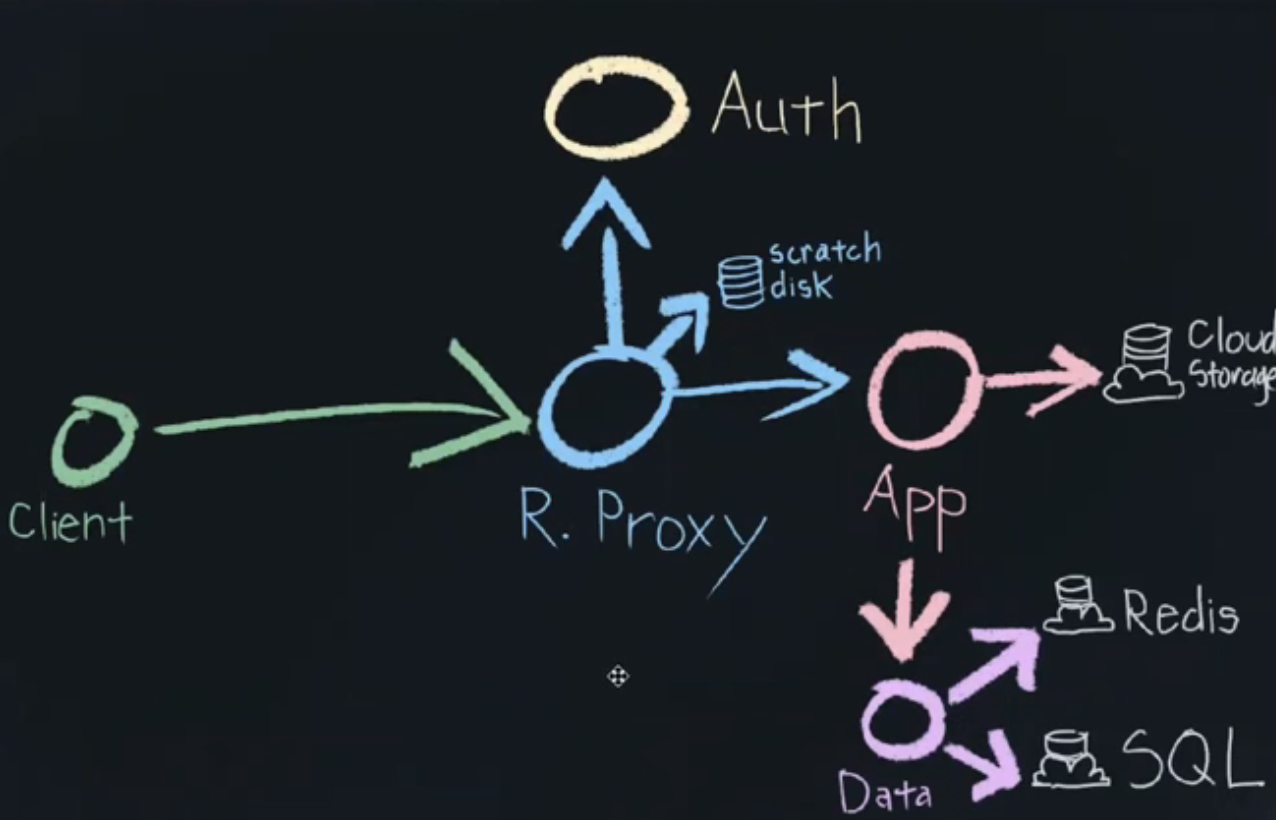
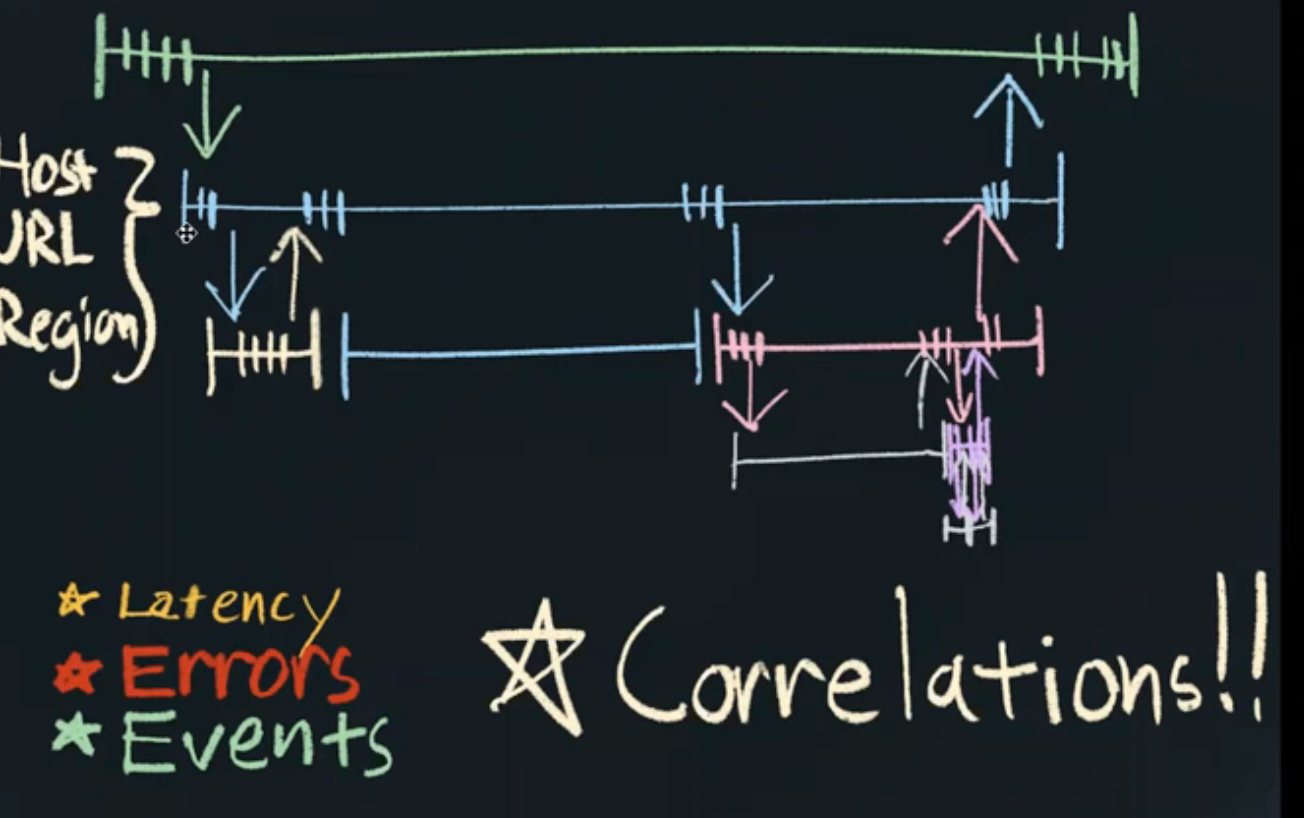
Suppose we had the scenario below:
 In OpenTelemetry, we can also include the following metadata in our Spans:
Operation name #
The name of the microservice being executed, or a function call
Start timestamp #
End timestamp (or duration)
Attributes #
(Optional) List of key-value pairs used for aggregation or for filtering trace data (e.g. customer identifier, process hostname). Used to describe and contextualize the work being done under a Span.
Events #
(Optional) Time-stamped strings which are made up timestamp, name, and (optional) Attributes. Used to describe and contextualize the work being done under a Span.
Parent ID #
Unique identifier of the Span’s parent
Links #
(Optional) References to other causally-related Spans
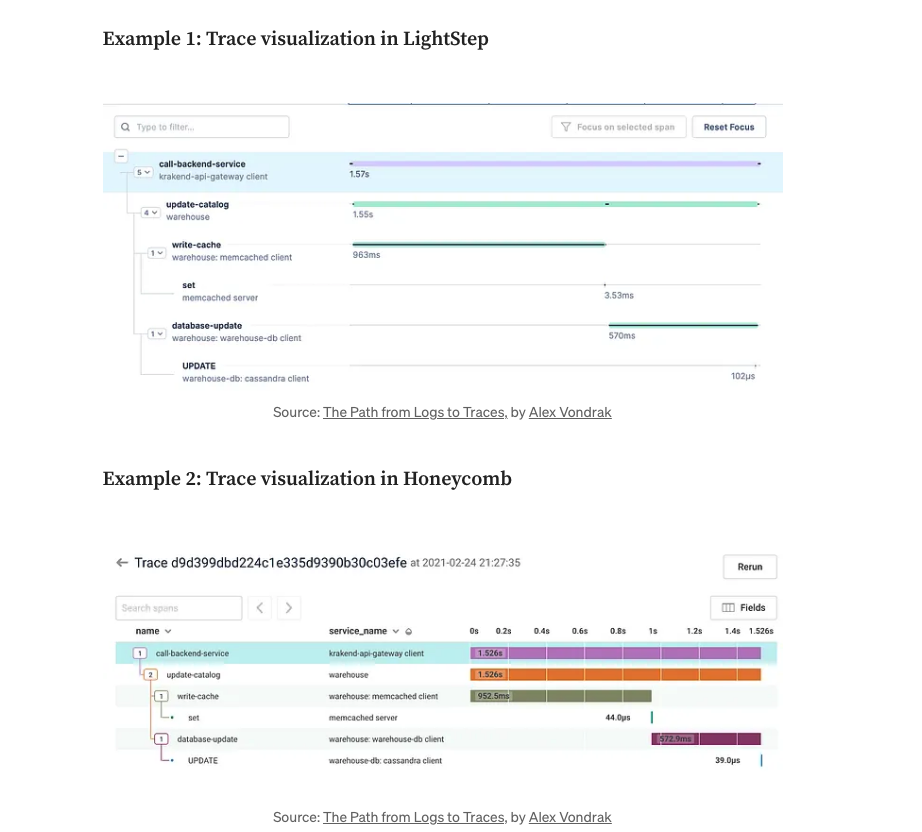
Traces #
Traces are also known as distributed traces. They traverse network, process, and security boundaries, to give you a holistic view of your system.
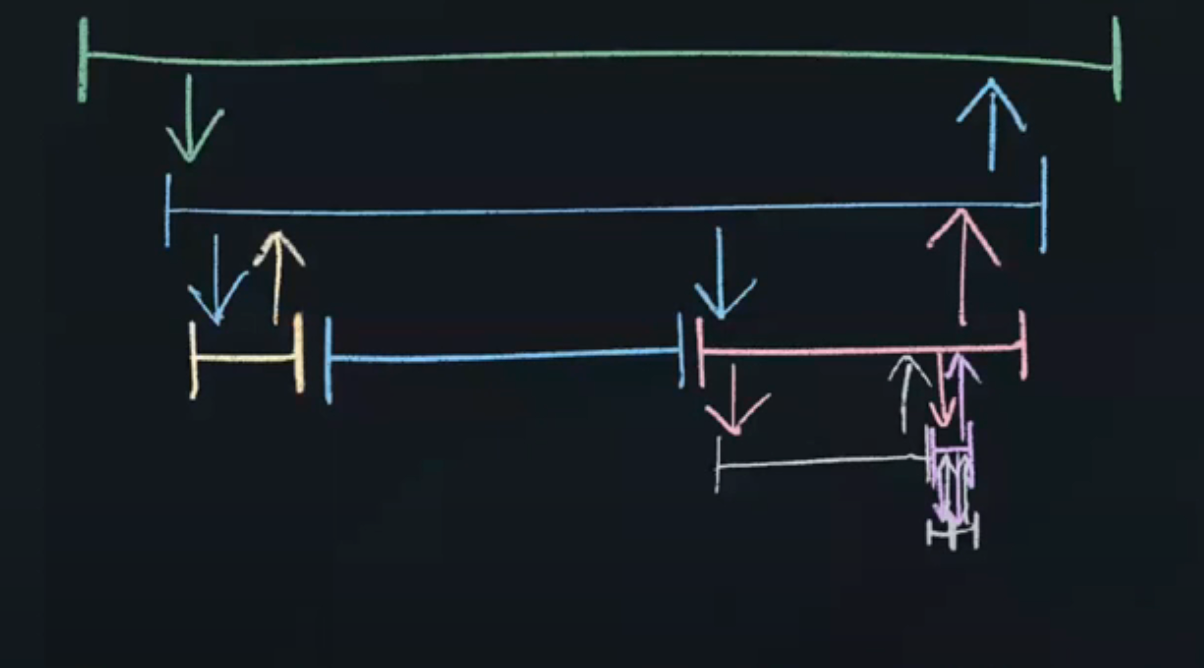
A Span is the basic building block of a Trace. A Trace is made up of a tree of Spans, starting with a Root Span (i.e. Span with no parent), which encapsulates the end-to-end time that it takes to accomplish a task. The Root Span represents a single logical operation, such as clicking a button to add an item to a shopping cart.
Example of trace #
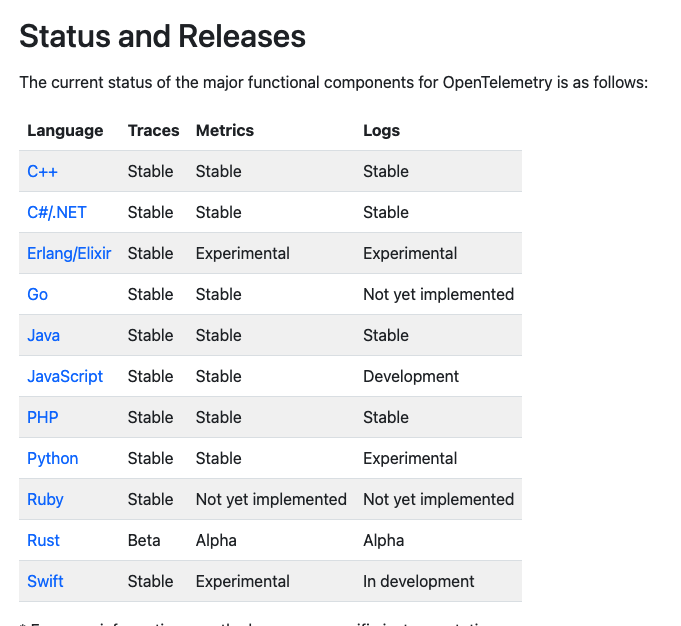
Programming Languages Supported #
#
Projects #
invoicing-apis deployed on OCI
Documentation followed to send the logs to OCI APM #
https://docs.oracle.com/en/cloud/paas/application-performance-monitoring/apmpy/#step_five https://opentelemetry-python-contrib.readthedocs.io/en/latest/instrumentation/django/django.html