Observability
tags :
Summary #
According to Gartner’s report applied observability is top technology trends of 2023.
In the Observability space, 4 cloud native standard has been involved in the recent year
MELT #
Metrics #
Metrics are numerical measurements that offer a high-level view of a system’s performance. -CPU % used
- Error rate
Events #
Events in MELT are discrete occurrences with precise temporal and numerical values, enabling us to track crucial events and detect potential problems related to a user request. Put simply — these events are something that has happened in a system at a point in time.
- User login attempts
- Alert notifications
- HTTP requests/responses
Logs #
Logs provide a descriptive record of the system’s behavior at a given time, serving as an essential tool for debugging
Traces #
A trace refers to the entire path of a request or workflow as it progresses from one component of the system to another, capturing the end-to-end request flow through a distributed system.
OpenTracing #
OpenCensus #
OpenMetrics #
OpenTelemetry #
OpenTelemetry is trying to solve bigger problem, OpenTelemetry combines OpenTracing, OpenCensus and OpenMetrics and making as single industry cloud native data format standard for Observability area.
Django and Wagtail #
These settings used Azm X CMS project, the logs were getting propagated to Papertrail
LOGGING =
    "version": 1,
    "disable_existing_loggers": False,
    "handlers":
        "console":
            "class": "logging.StreamHandler",
        ,
    ,
    "loggers":
        "django":
            "handlers": ["console"],
            "level": os.getenv("DJANGO_LOG_LEVEL", "INFO"),
        ,
    ,
trace vs span vs event #
trace is collection of operations, span is a single operation in a trace.
trace > span > event
trace #
| span-1- span-2——–spann |
span #
span -> |event-1-event2—-event-n|
event #
something with timestamp, without duration.
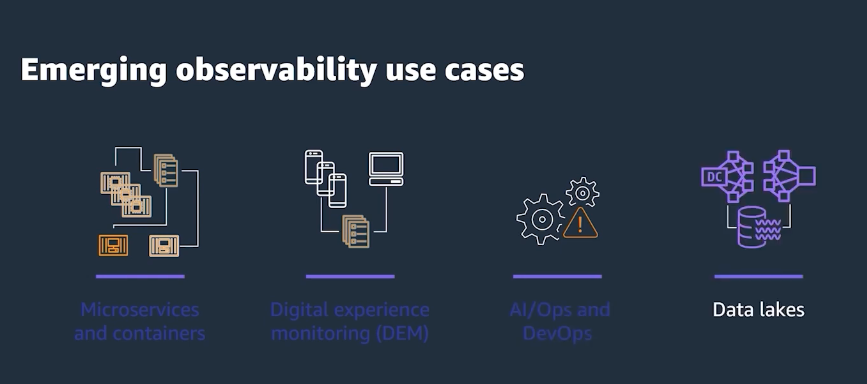
Emerging Observability Use Cases #
- To reduce mean time to resolution (MTR)
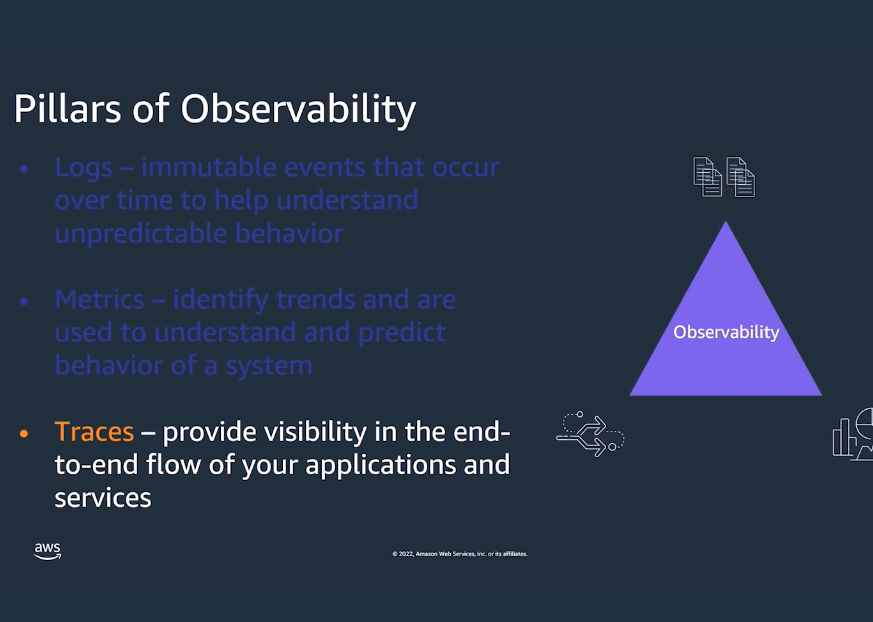
Pillars of Observability #
OpenTelemetry is becoming an open standard for the Observability #
OCR of Images #
2024-01-14_22-02-53_screenshot.png #
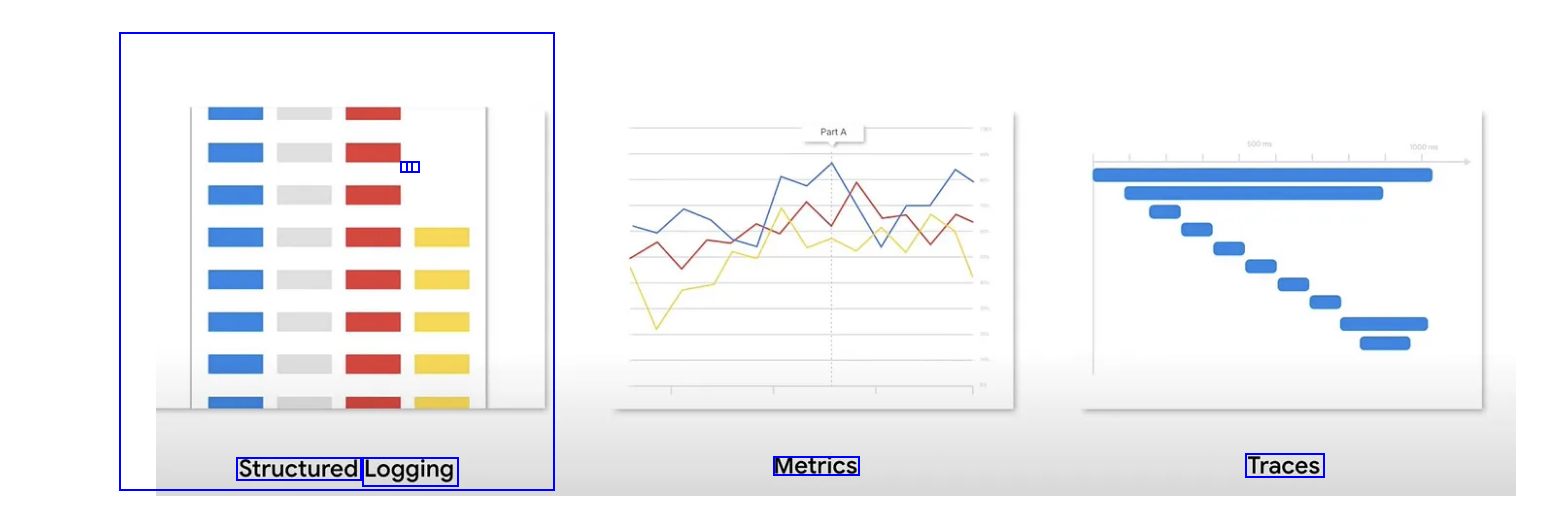
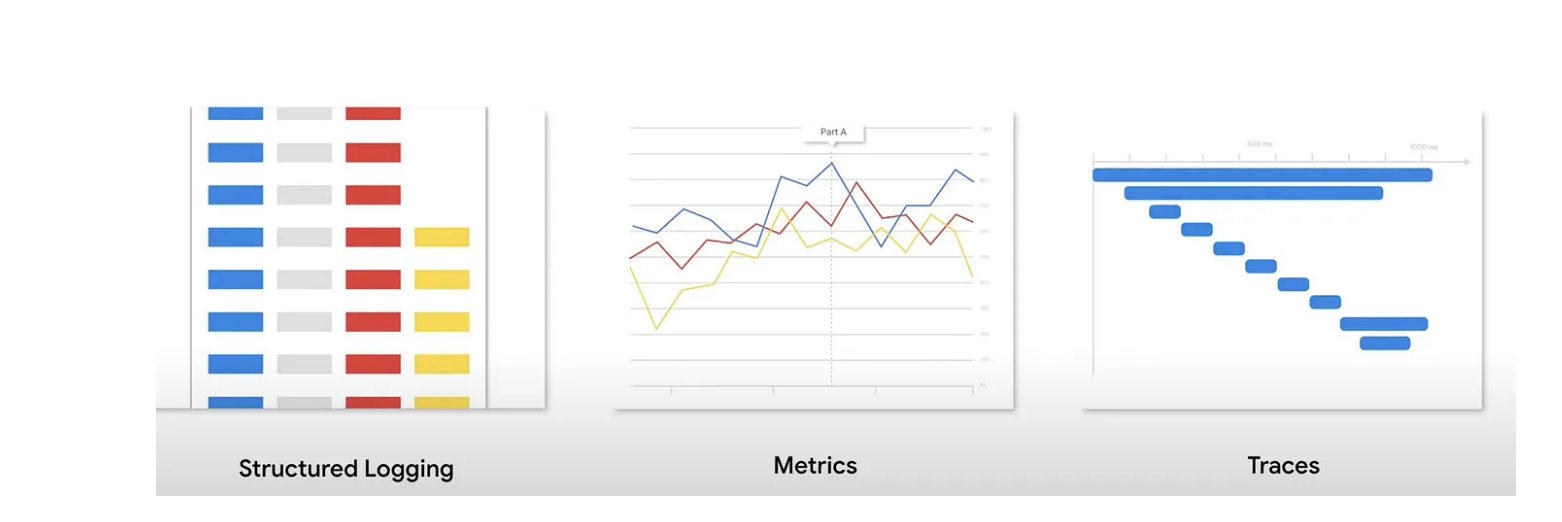
- - Structured Logging Metrics Traces IL
2024-01-14_22-04-24_screenshot.png #
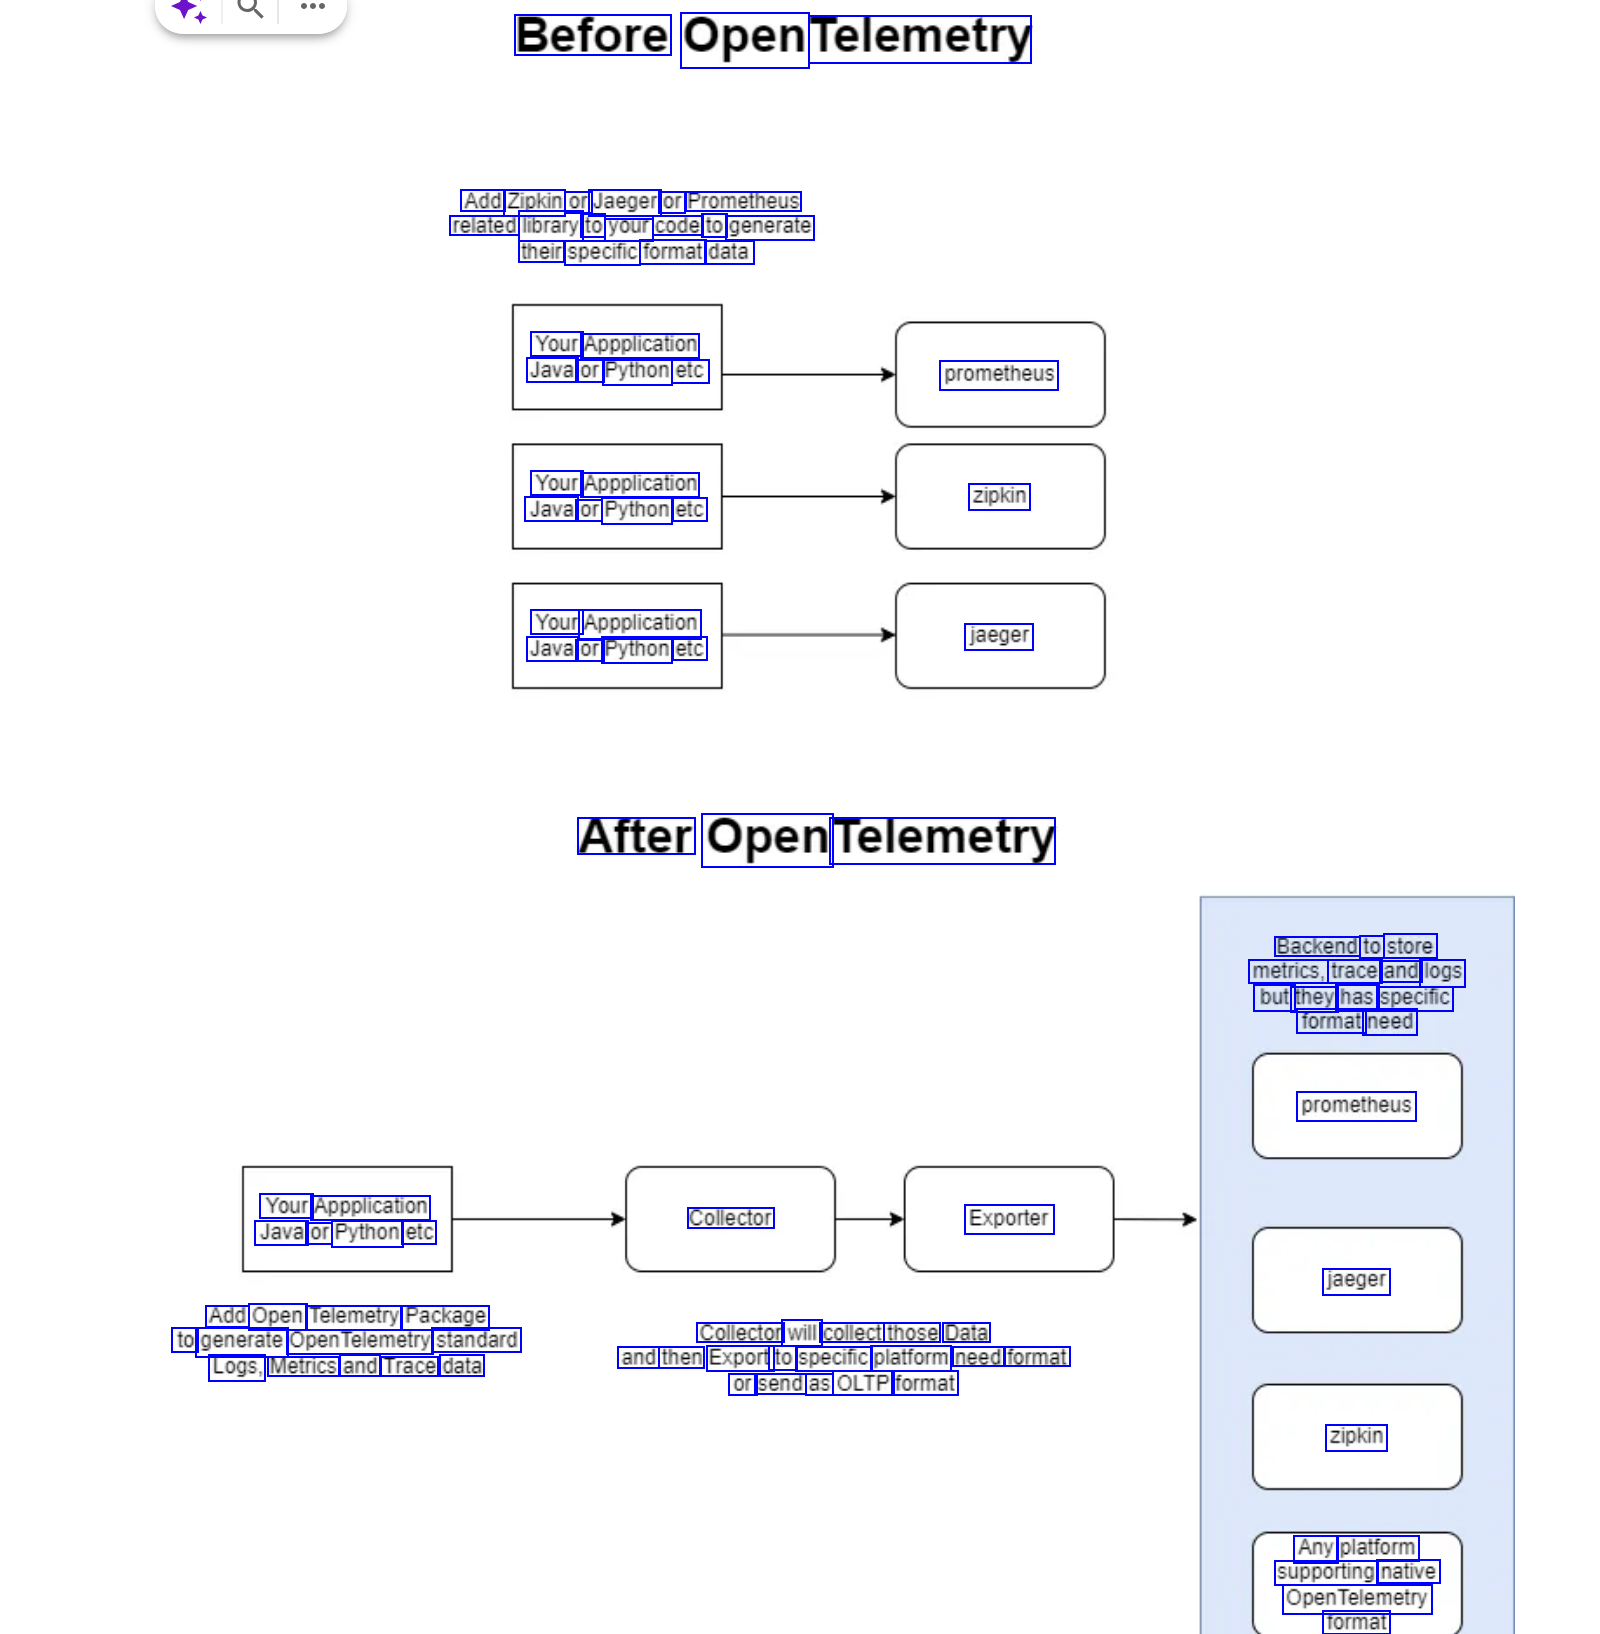
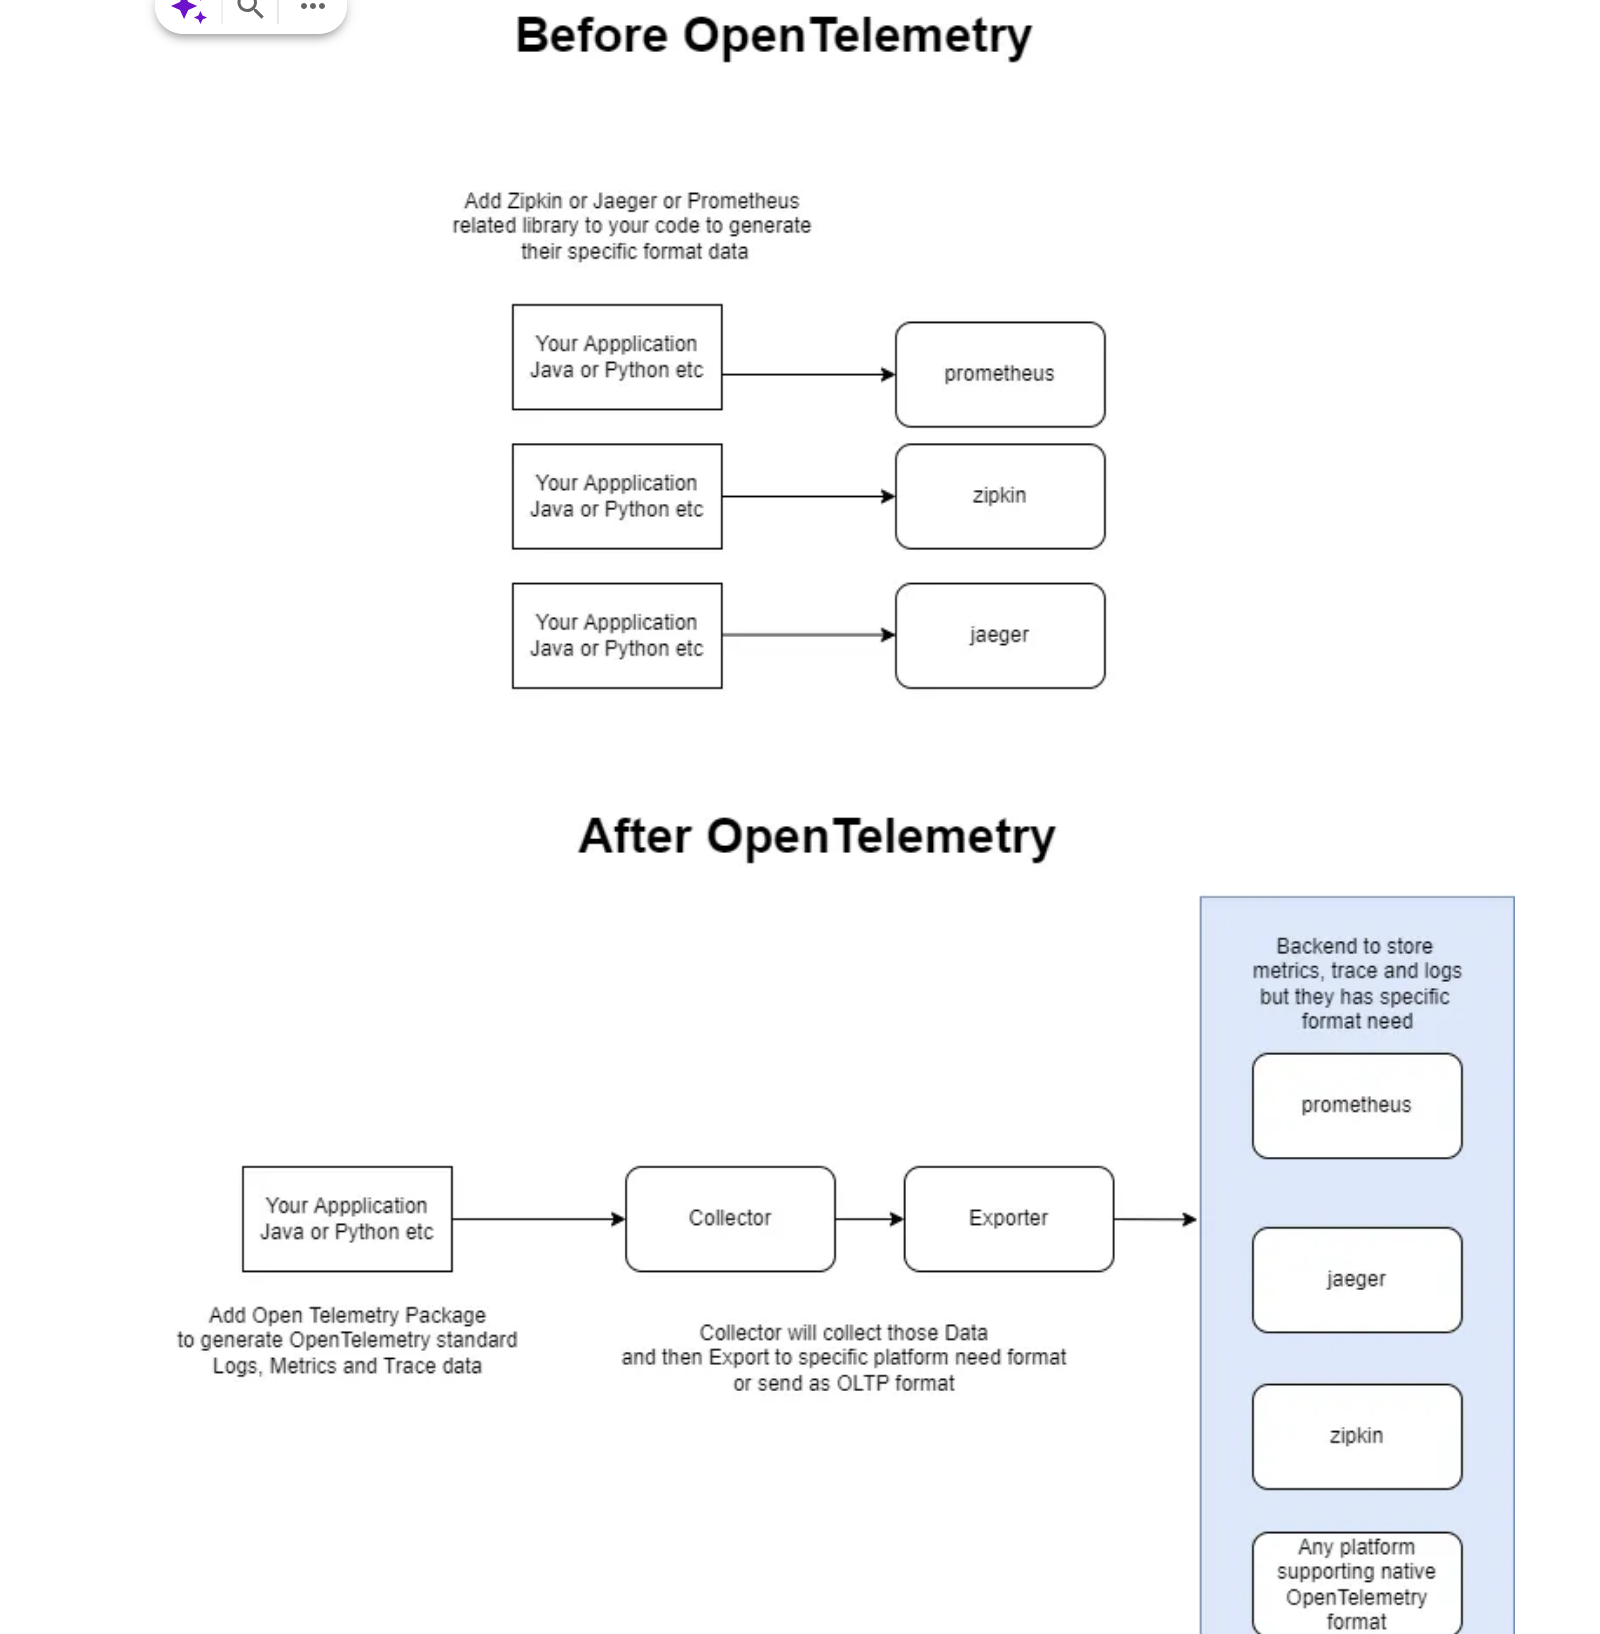
Before Open Telemetry Add Zipkin or Jaeger or Prometheus related library to your code to generate their specific format data Your Appplication Java or Python etc prometheus Your Appplication Java or Python etc zipkin Your Appplication Java or Python etc jaeger After Open Telemetry Backend to store metrics, trace and logs but they has specific format need prometheus Your Appplication Java or Python etc Add Open Telemetry Package to generate OpenTelemetry standard Logs, Metrics and Trace data Collector Exporter jaeger Collector will collect those Data and then Export to specific platform need format or send as OLTP format zipkin Any platform supporting native OpenTelemetry format
2024-06-22_13-06-14_screenshot.png #
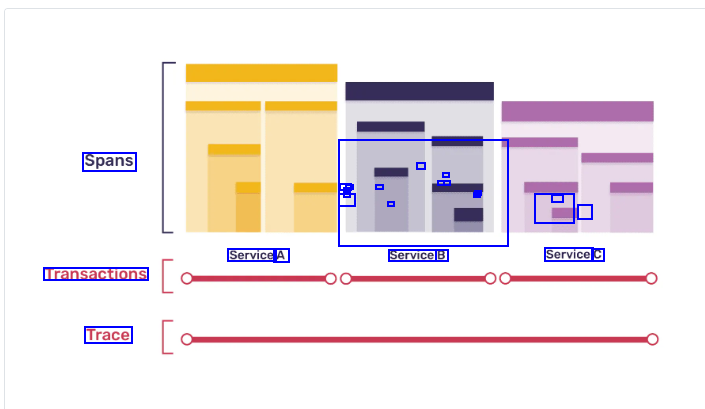
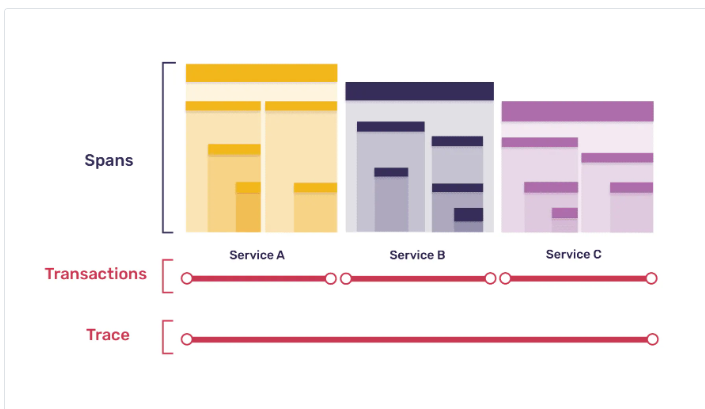
Spans - - - - - - - - - - - - - - - I TE Service A Service B Service C Transactions Trace
2024-11-05_12-34-21_screenshot.png #
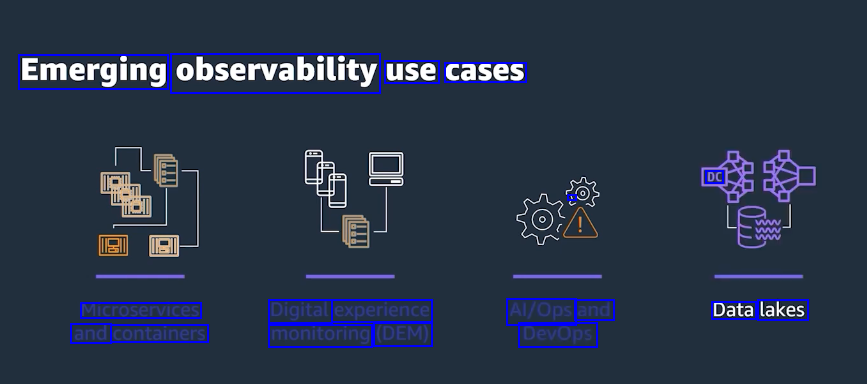
Emerging observability use cases DC ) Microservices and containers Digital experience monitoring (DEM) Al/Ops and DevOps Data lakes
2024-11-05_12-36-00_screenshot.png #
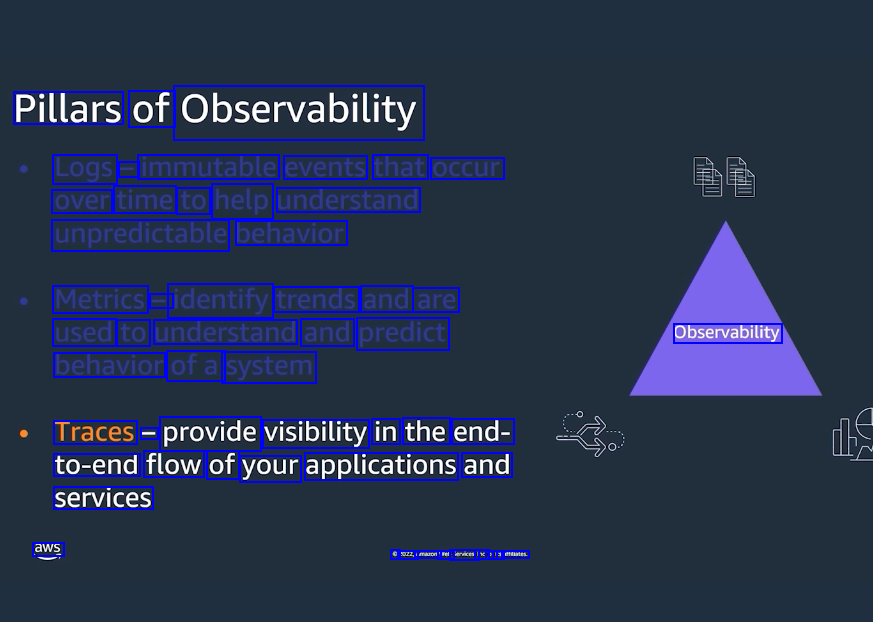
Pillars of Observability Logs - immutable events that occur over time to help understand unpredictable behavior Metrics - identify trends and are used to understand and predict Observability behavior ofa system Traces - provide visibility in the end- to-end flow of your applications and services aws o Sr Amaon web: Serices, inc orl its aftliates
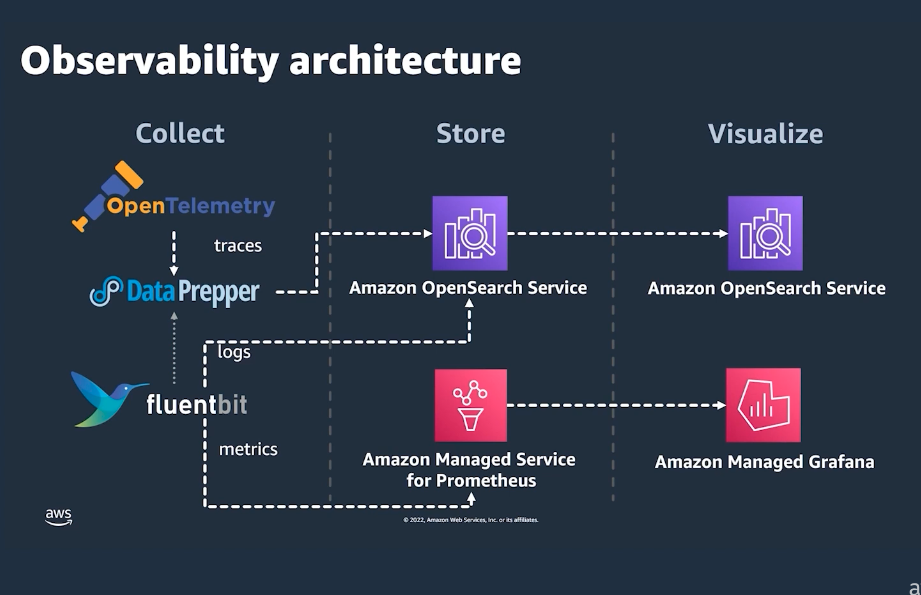
2024-11-05_12-37-49_screenshot.png #
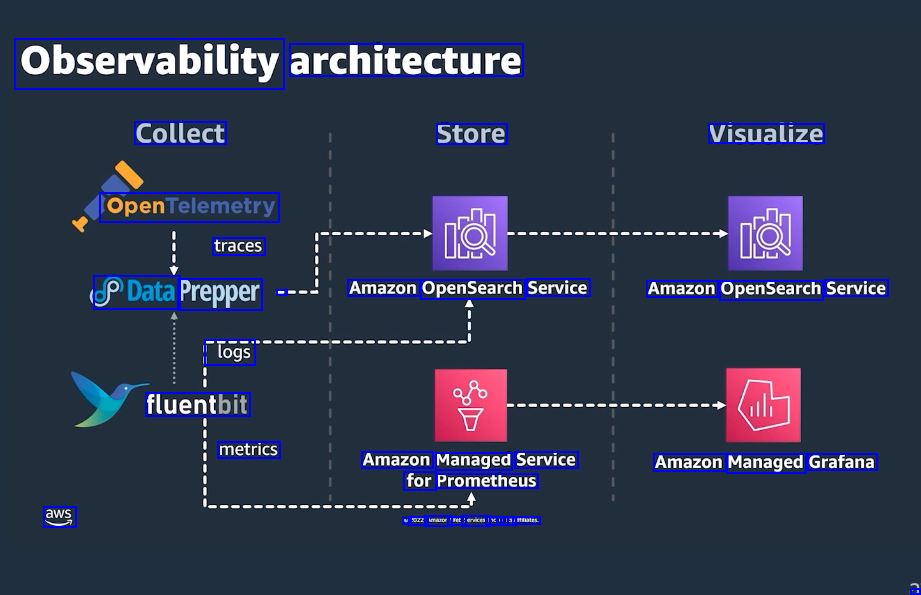
Observability architecture Collect Store Visualize OpenTelemetry traces PData Prepper - Amazon OpenSearch Service Amazon OpenSearch Service logs fluentbit metrics Amazon Managed Service for Prometheus Amazon Managed Grafana aws le 2022, Amaon web! Serices, inc or ts atiates -
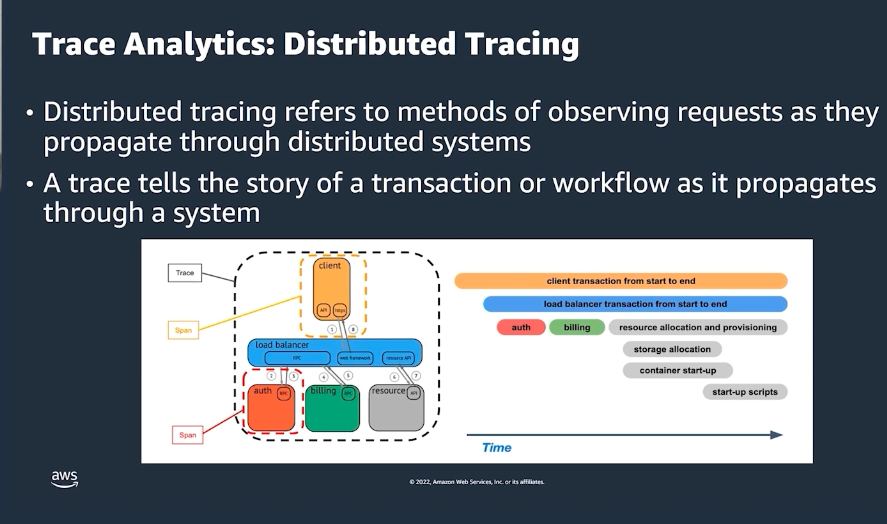
2024-11-05_12-39-38_screenshot.png #
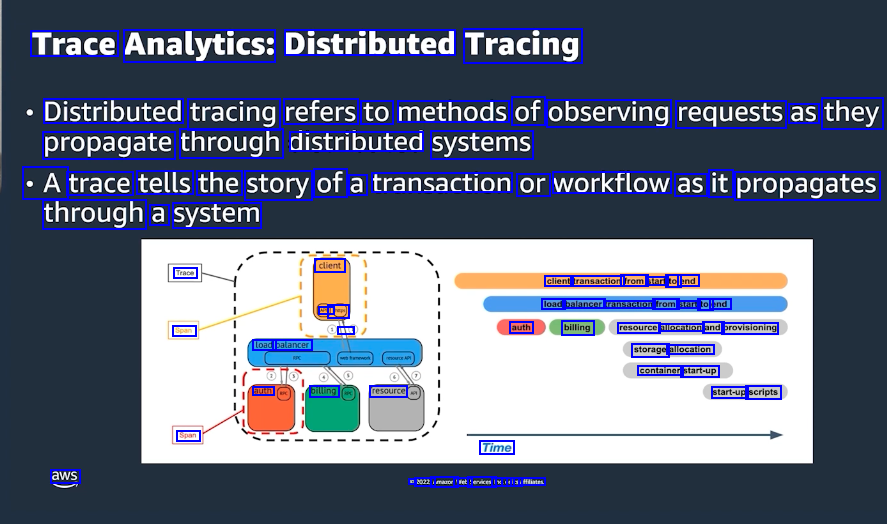
Trace Analytics: Distributed Tracing Distributed tracing refers to methods of observing requests as they propagate through distributed systems A trace tells the story of a transaction or workflow as it propagates through a system client Trace client transaction from start to end load balancer transaction from start to end auth billing resource allocation and provisioning ( Span load balancer storage allocation container start-up auth billing resource start-up scripts Span Time aws 3 3022, Amaron web! Serices, Inc or its affitiates
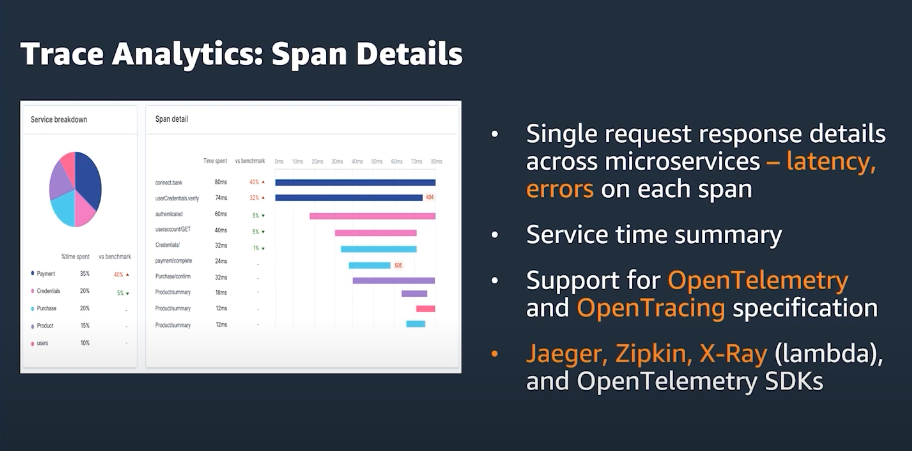
2024-11-05_12-40-32_screenshot.png #
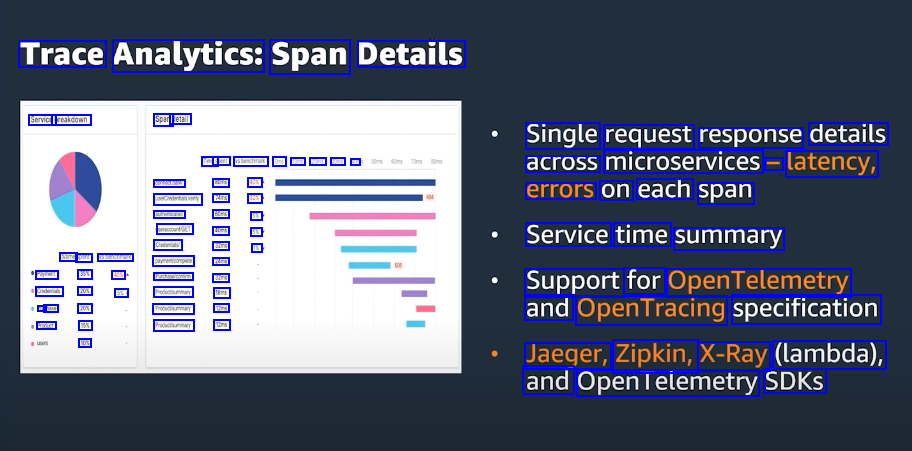
Trace Analytics: Span Details Service breakdoun Span detail Single request response details across microservices - latency, Tmes spent vsbenchmant Ons 1rs Ors JOms - connedttank Blms 401 Mrs unCedertssvery 321 tertond 60ms SN MRICOUEGET aDms 5N Oudertals errors each on span Service time Sins 18 summary ime pent sbenchrant paymerticomplee Nns Paymert 351 43 Pachasetonir s2ns Crudentias 20 Us nase 205 aduct 15N 10s for 5 hoductummary Ems Produchummary Tns Podchurmary Uns Support OpenTelemetry and OpenTracing specification Jaeger, Zipkin, X-Ray (lambda), and OpenTelemetry SDKS